Ready to swap out your old car for something a lil bit more eco-friendly?
If you’re thinking about making the shift to an electric vehicle, you’re probably curious to know how well-prepared your local area is for EVs - and so were we!
We’ve dived into the Aussie cities that are paving the way for EVs. From ample charging stations to innovative green initiatives, these cities are seriously electrifying the way we get around. Oh, and before you hit the road, don’t forget about insurance! You’ll need to look for car insurance that covers electric vehicles keeping in mind things like cover for the battery and charging cables too.
THE MOST EV-FRIENDLY CAPITAL CITIES IN AUSTRALIA
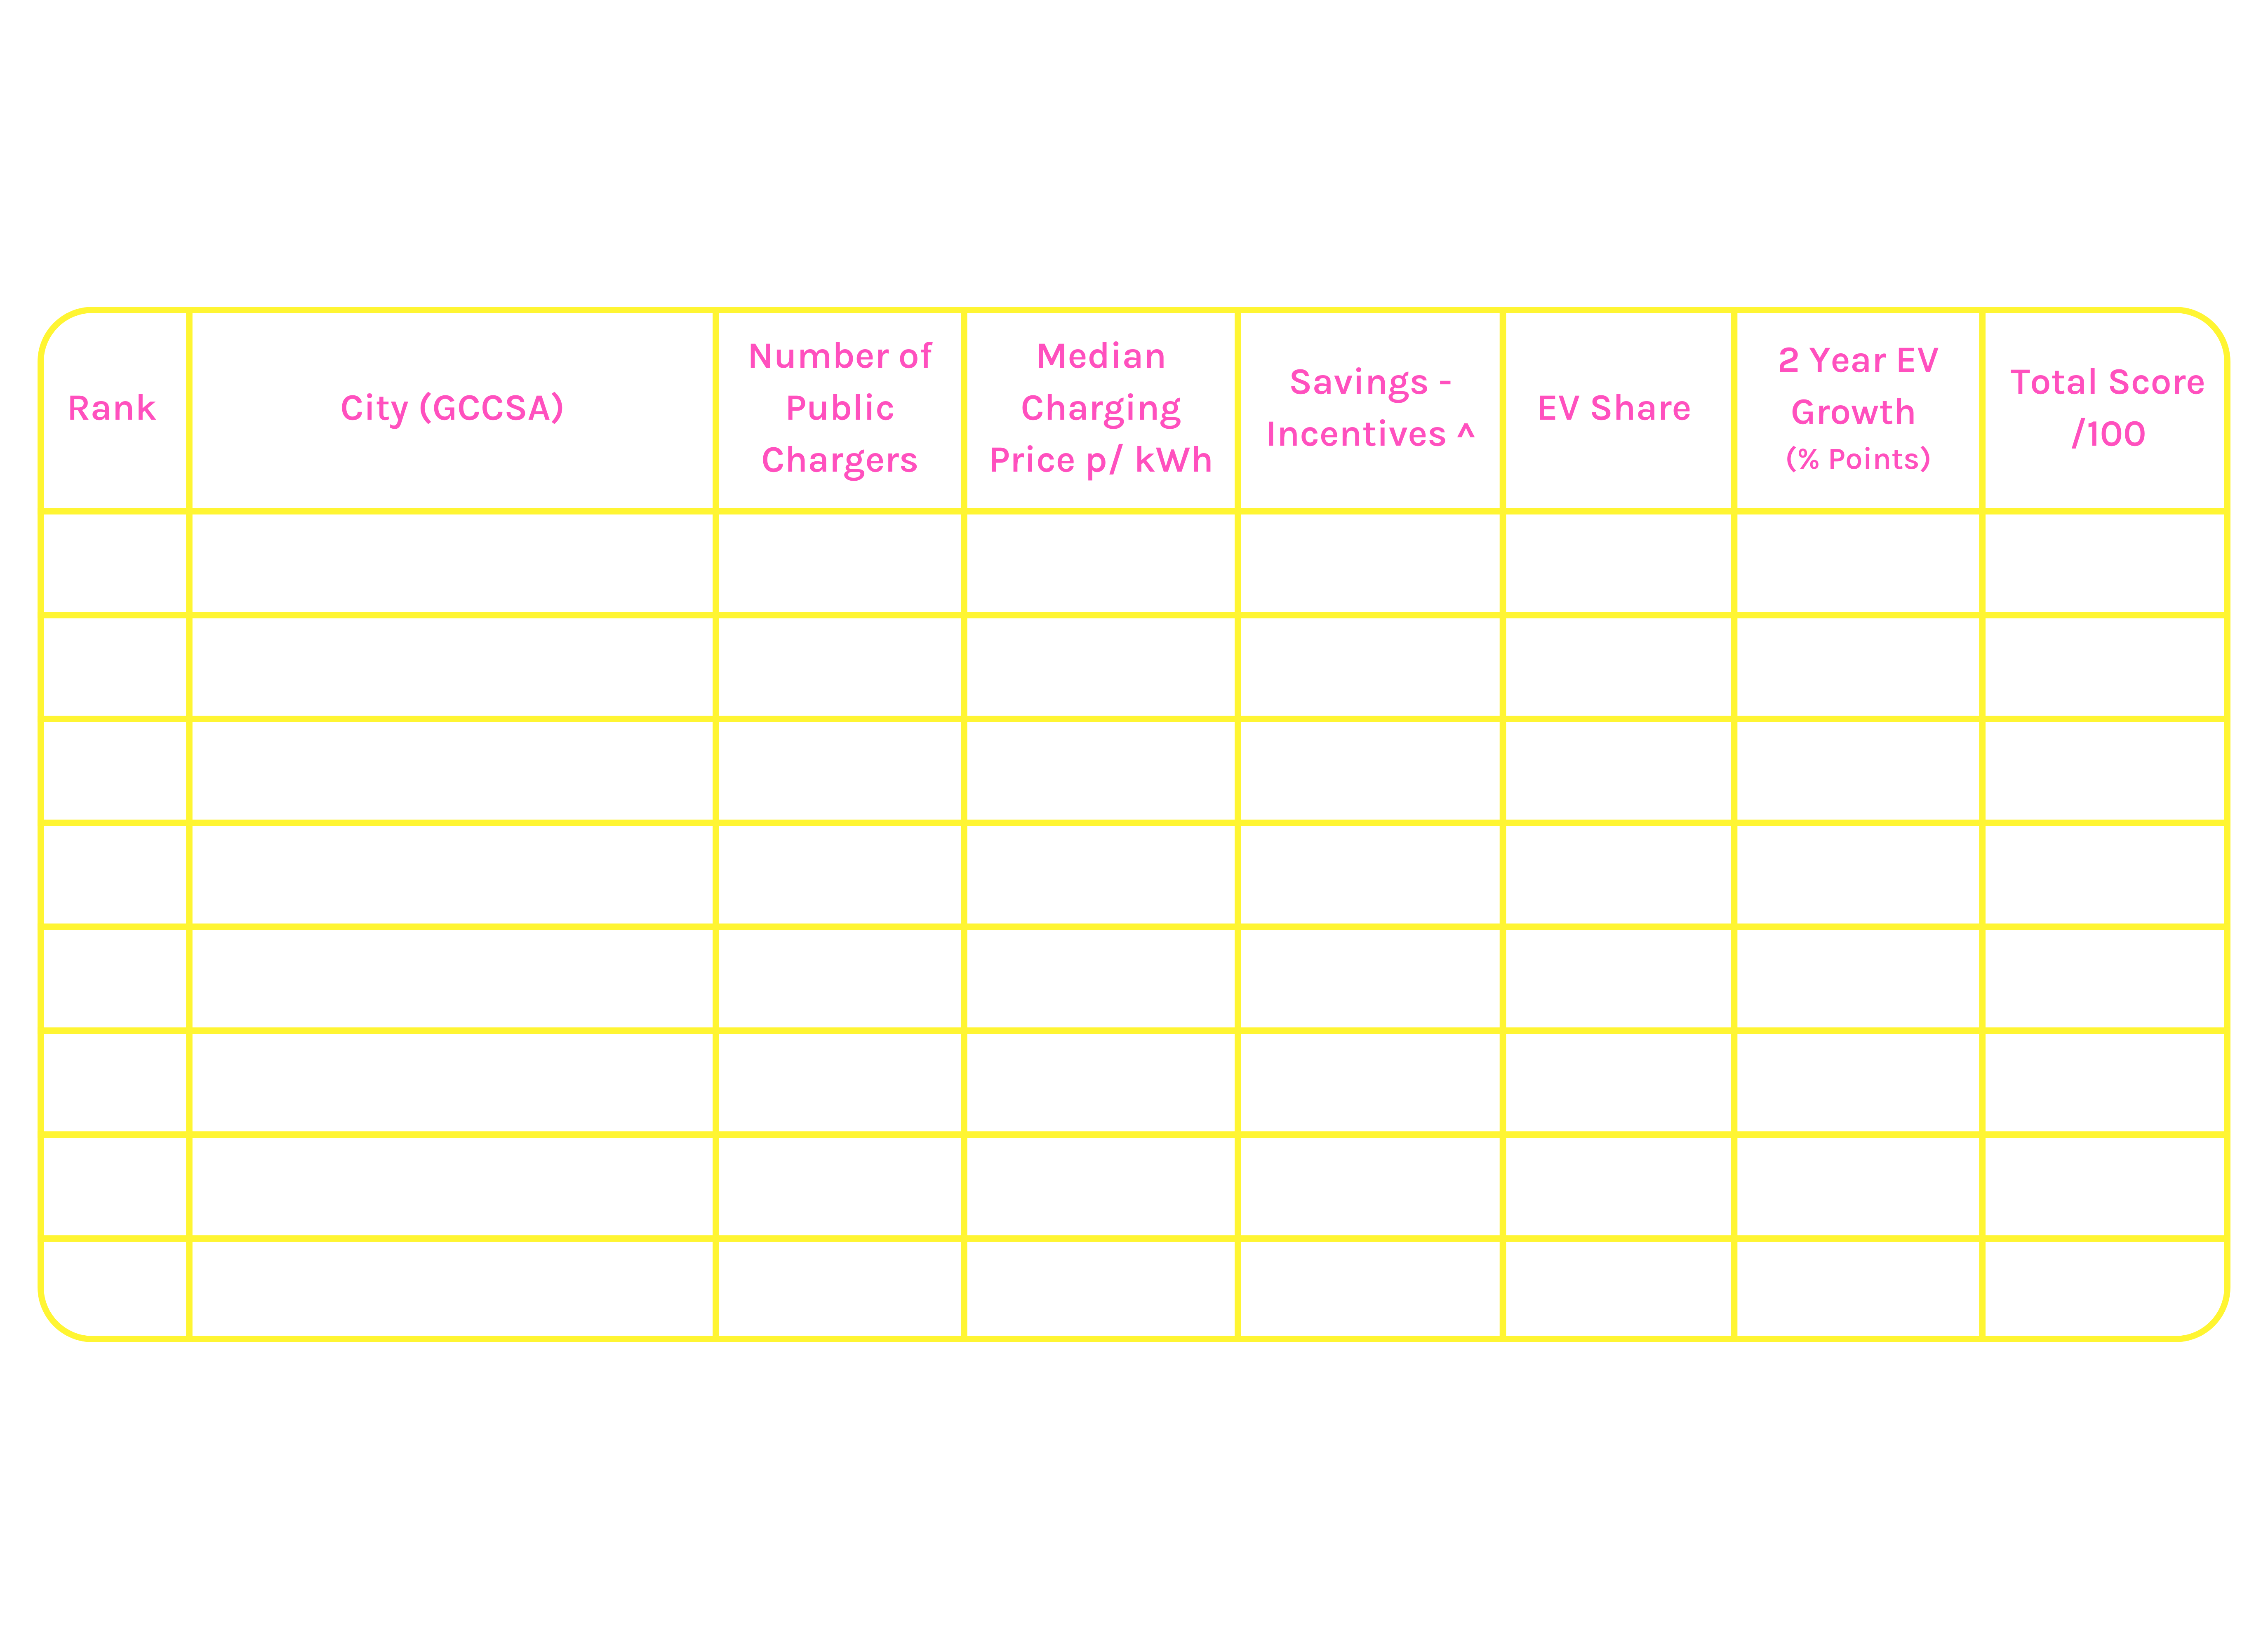
Own an EV in Melbourne? Good news, you live in the best capital city to drive an EV!
Greater Melbourne has amazing access to 249 public EV chargers, the second-highest number out of all capital cities after Sydney. Yet Melbourne pips Sydney to the post when it comes to the cost of charging - at $0.55 price per kWh compared to $0.58 per kWh in Sydney - as well as the incentive to save $100 if you buy an EV (New South Wales offers nothing!) That being said, Sydney places second place in the ranking, seeing the second-highest EV share and growth rate of all capital cities after Canberra.
If you’re dreaming of zipping around in an EV in Darwin, you’ll want to prepare, as the city has been named the least friendly for EV ownership. The city only has seven public EV chargers, the lowest out of Australia’s capitals, which makes it no surprise that EV share and growth are the lowest as well.
THE MOST EV-FRIENDLY REGIONS IN AUSTRALIA
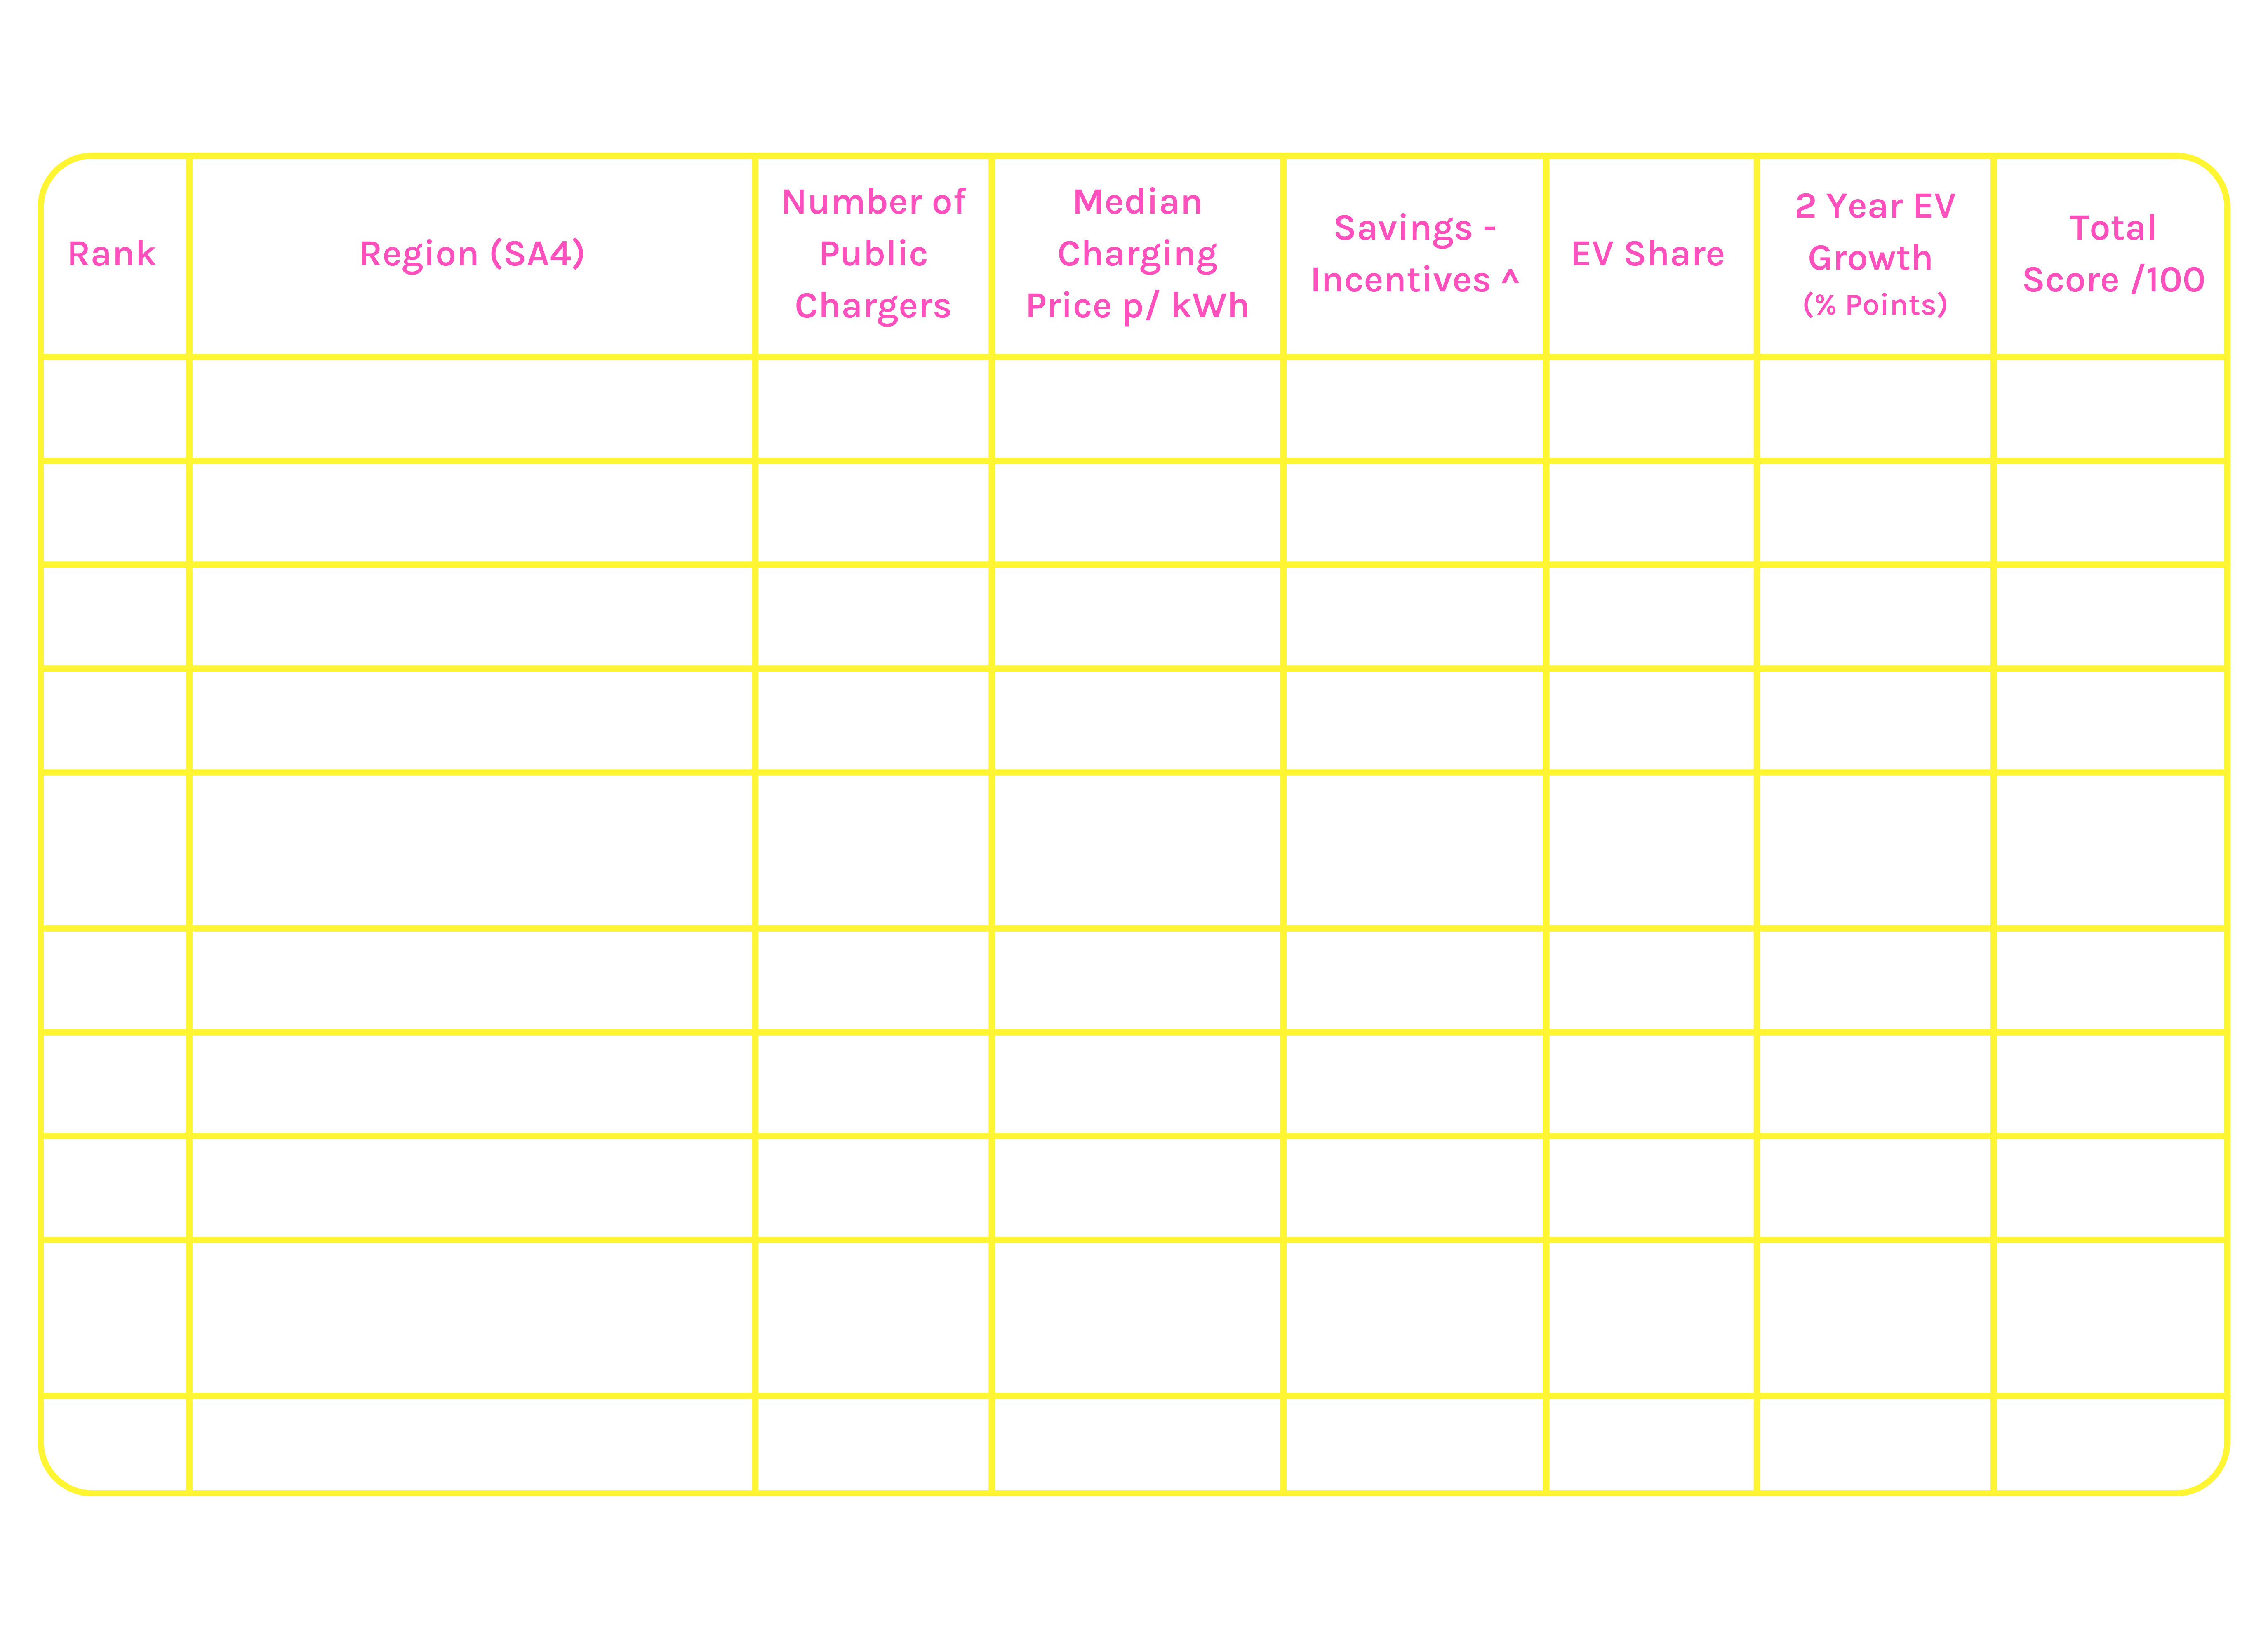
Outside of our capital cities, the Gold Coast ranks as the number one region (or SA4 if you’re using official titles) to own an EV. The Goldy boasts the second-highest number of public EV chargers in Australia, a pretty cheap cost of charging and a high EV share and growth.
Inner Melbourne, which covers Melbourne City, Port Phillip, Yarra, Moonee Valley, and Bayside, ranks in second place. The region has the 6th highest number of public chargers in Australia, which may explain its high EV share and growth rate. This could also be due to Inner Melbourne’s eco-conscious residents.
Australian Capital Territory ranks in third position. The region is in the top five for the number of public chargers available, boasts great incentives from the government and ranks top ten for EV share and growth rate.
THE LEAST EV-FRIENDLY REGIONS IN AUSTRALIA
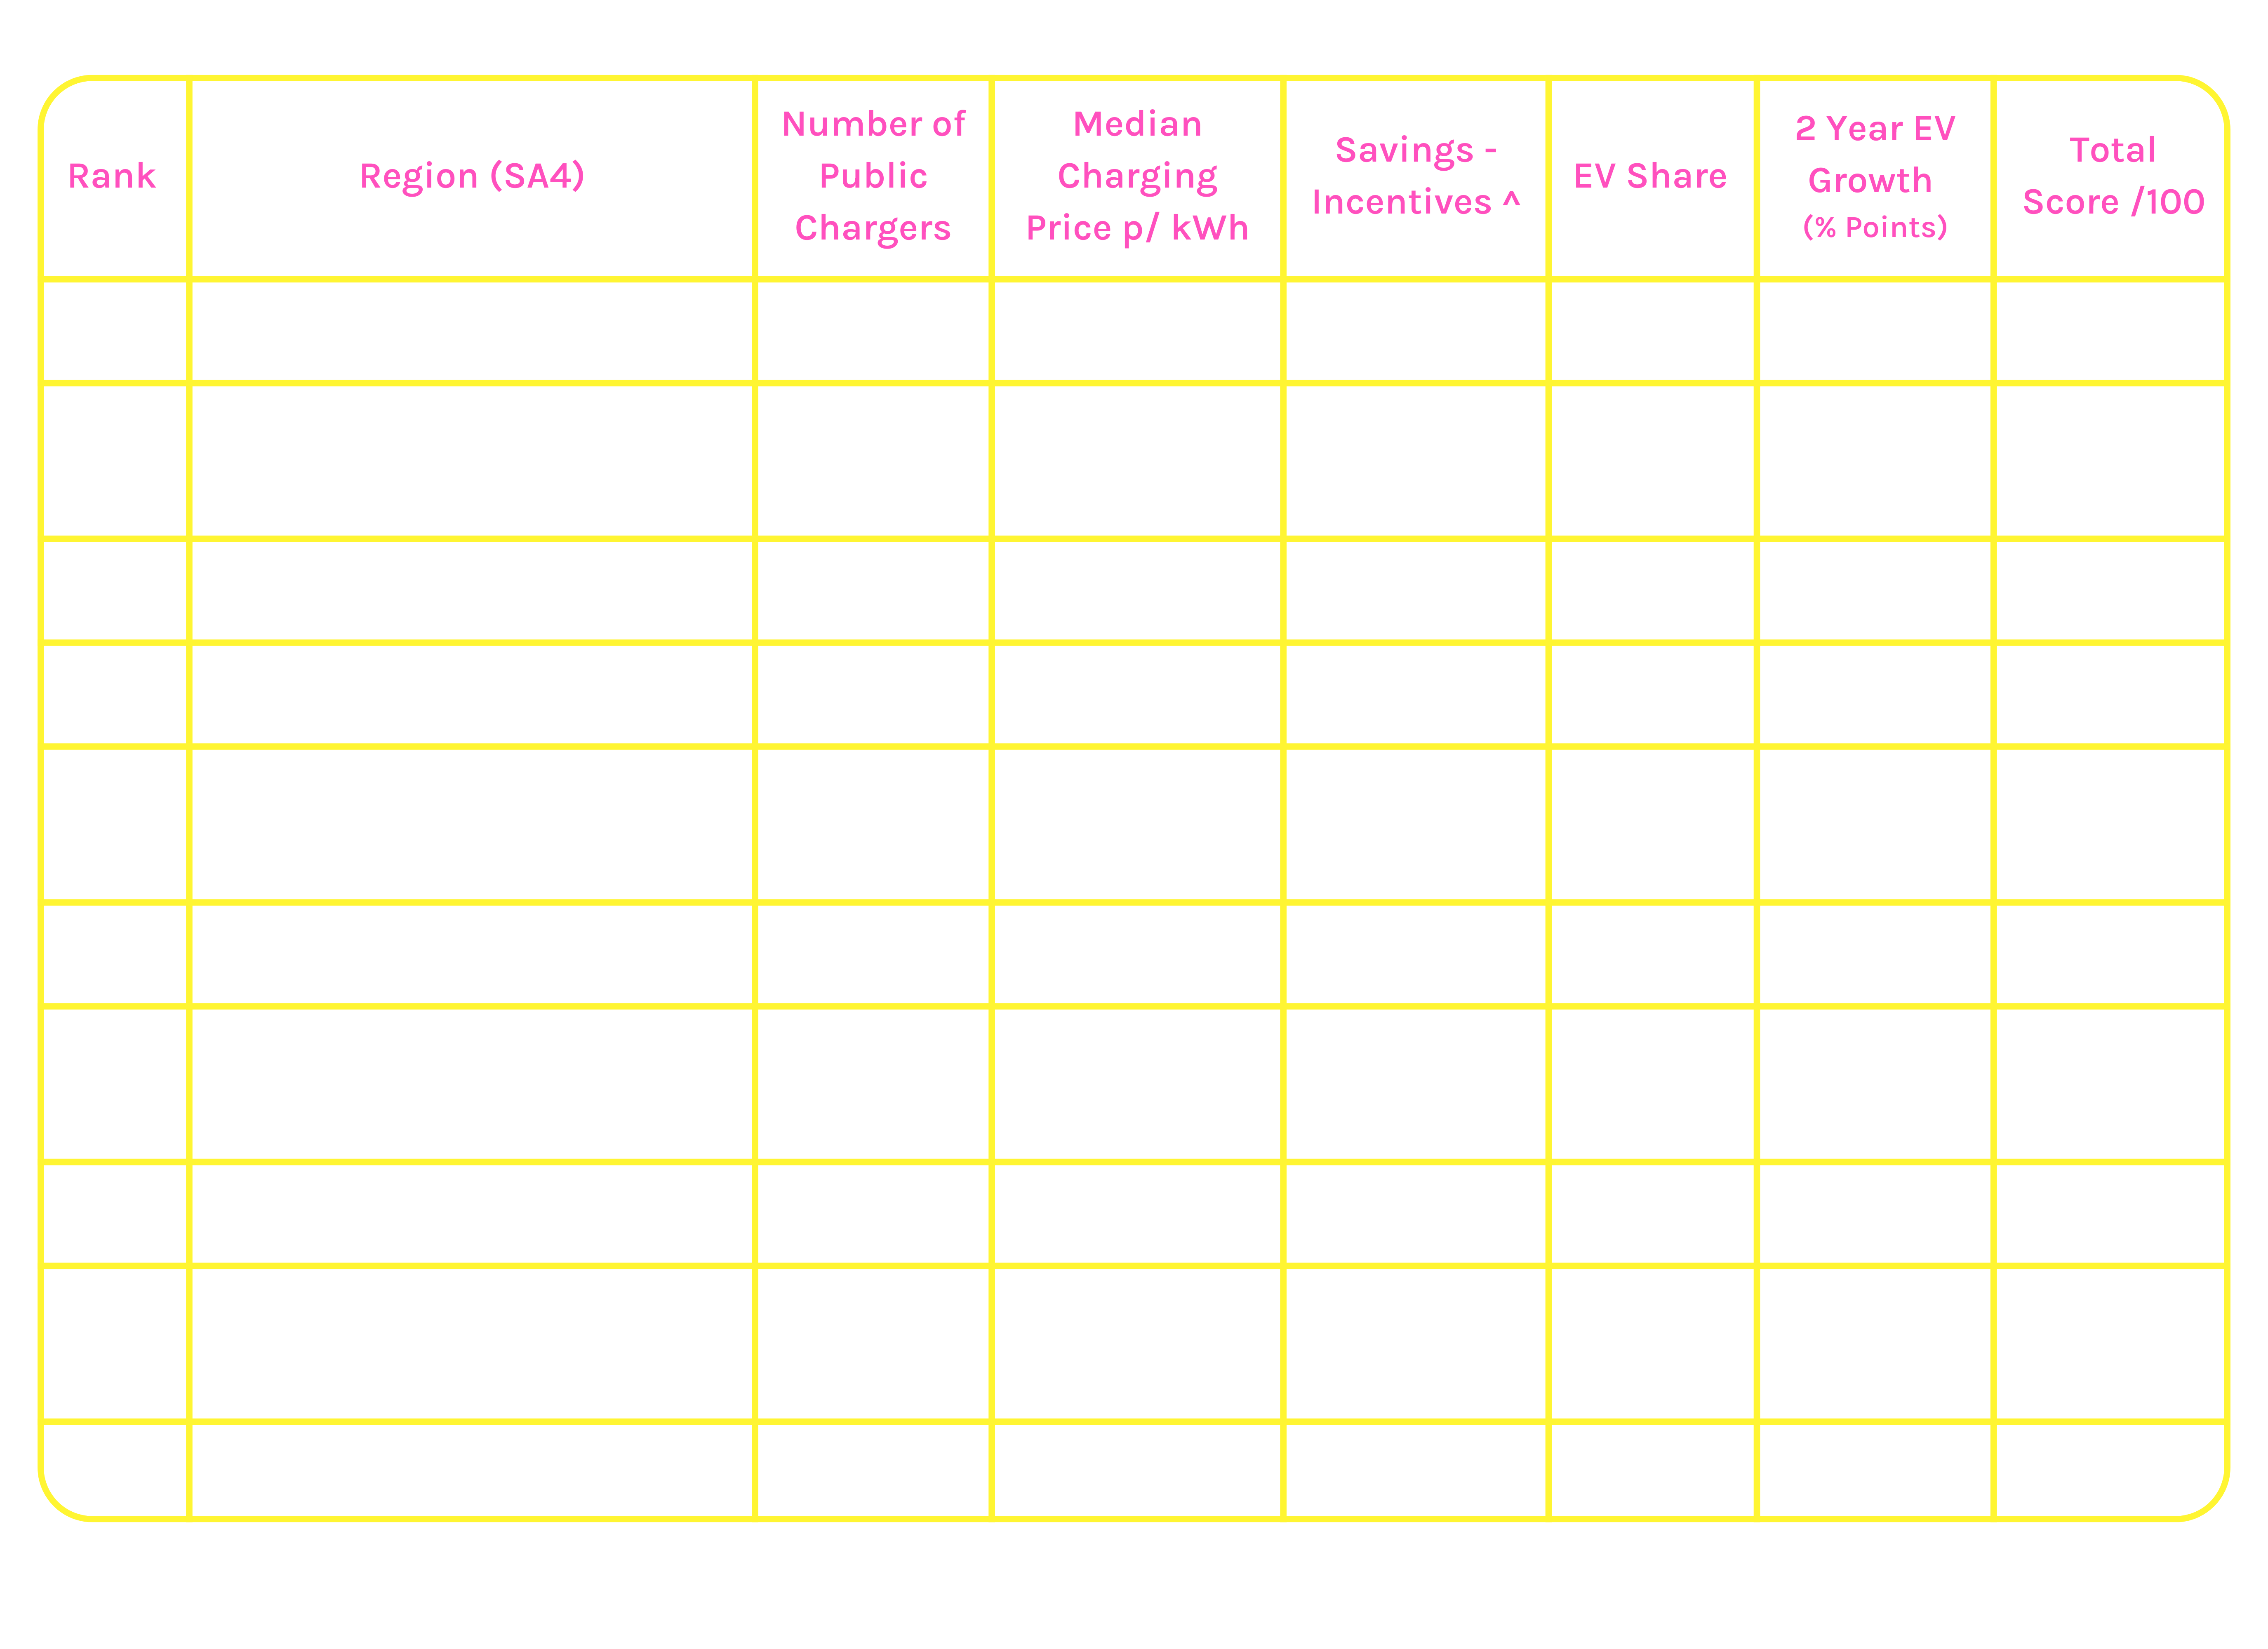
Surprisingly, a region of Sydney comes in first place in the Study. South West Sydney—the area covering Campbelltown, Liverpool, Wollondilly, and Fairfield—has only eight public chargers and a pricey $0.68 per kWh cost for charging. NSW also offers no benefits for EV drivers.
THE MOST EV-FRIENDLY SUB-REGIONS IN AUSTRALIA
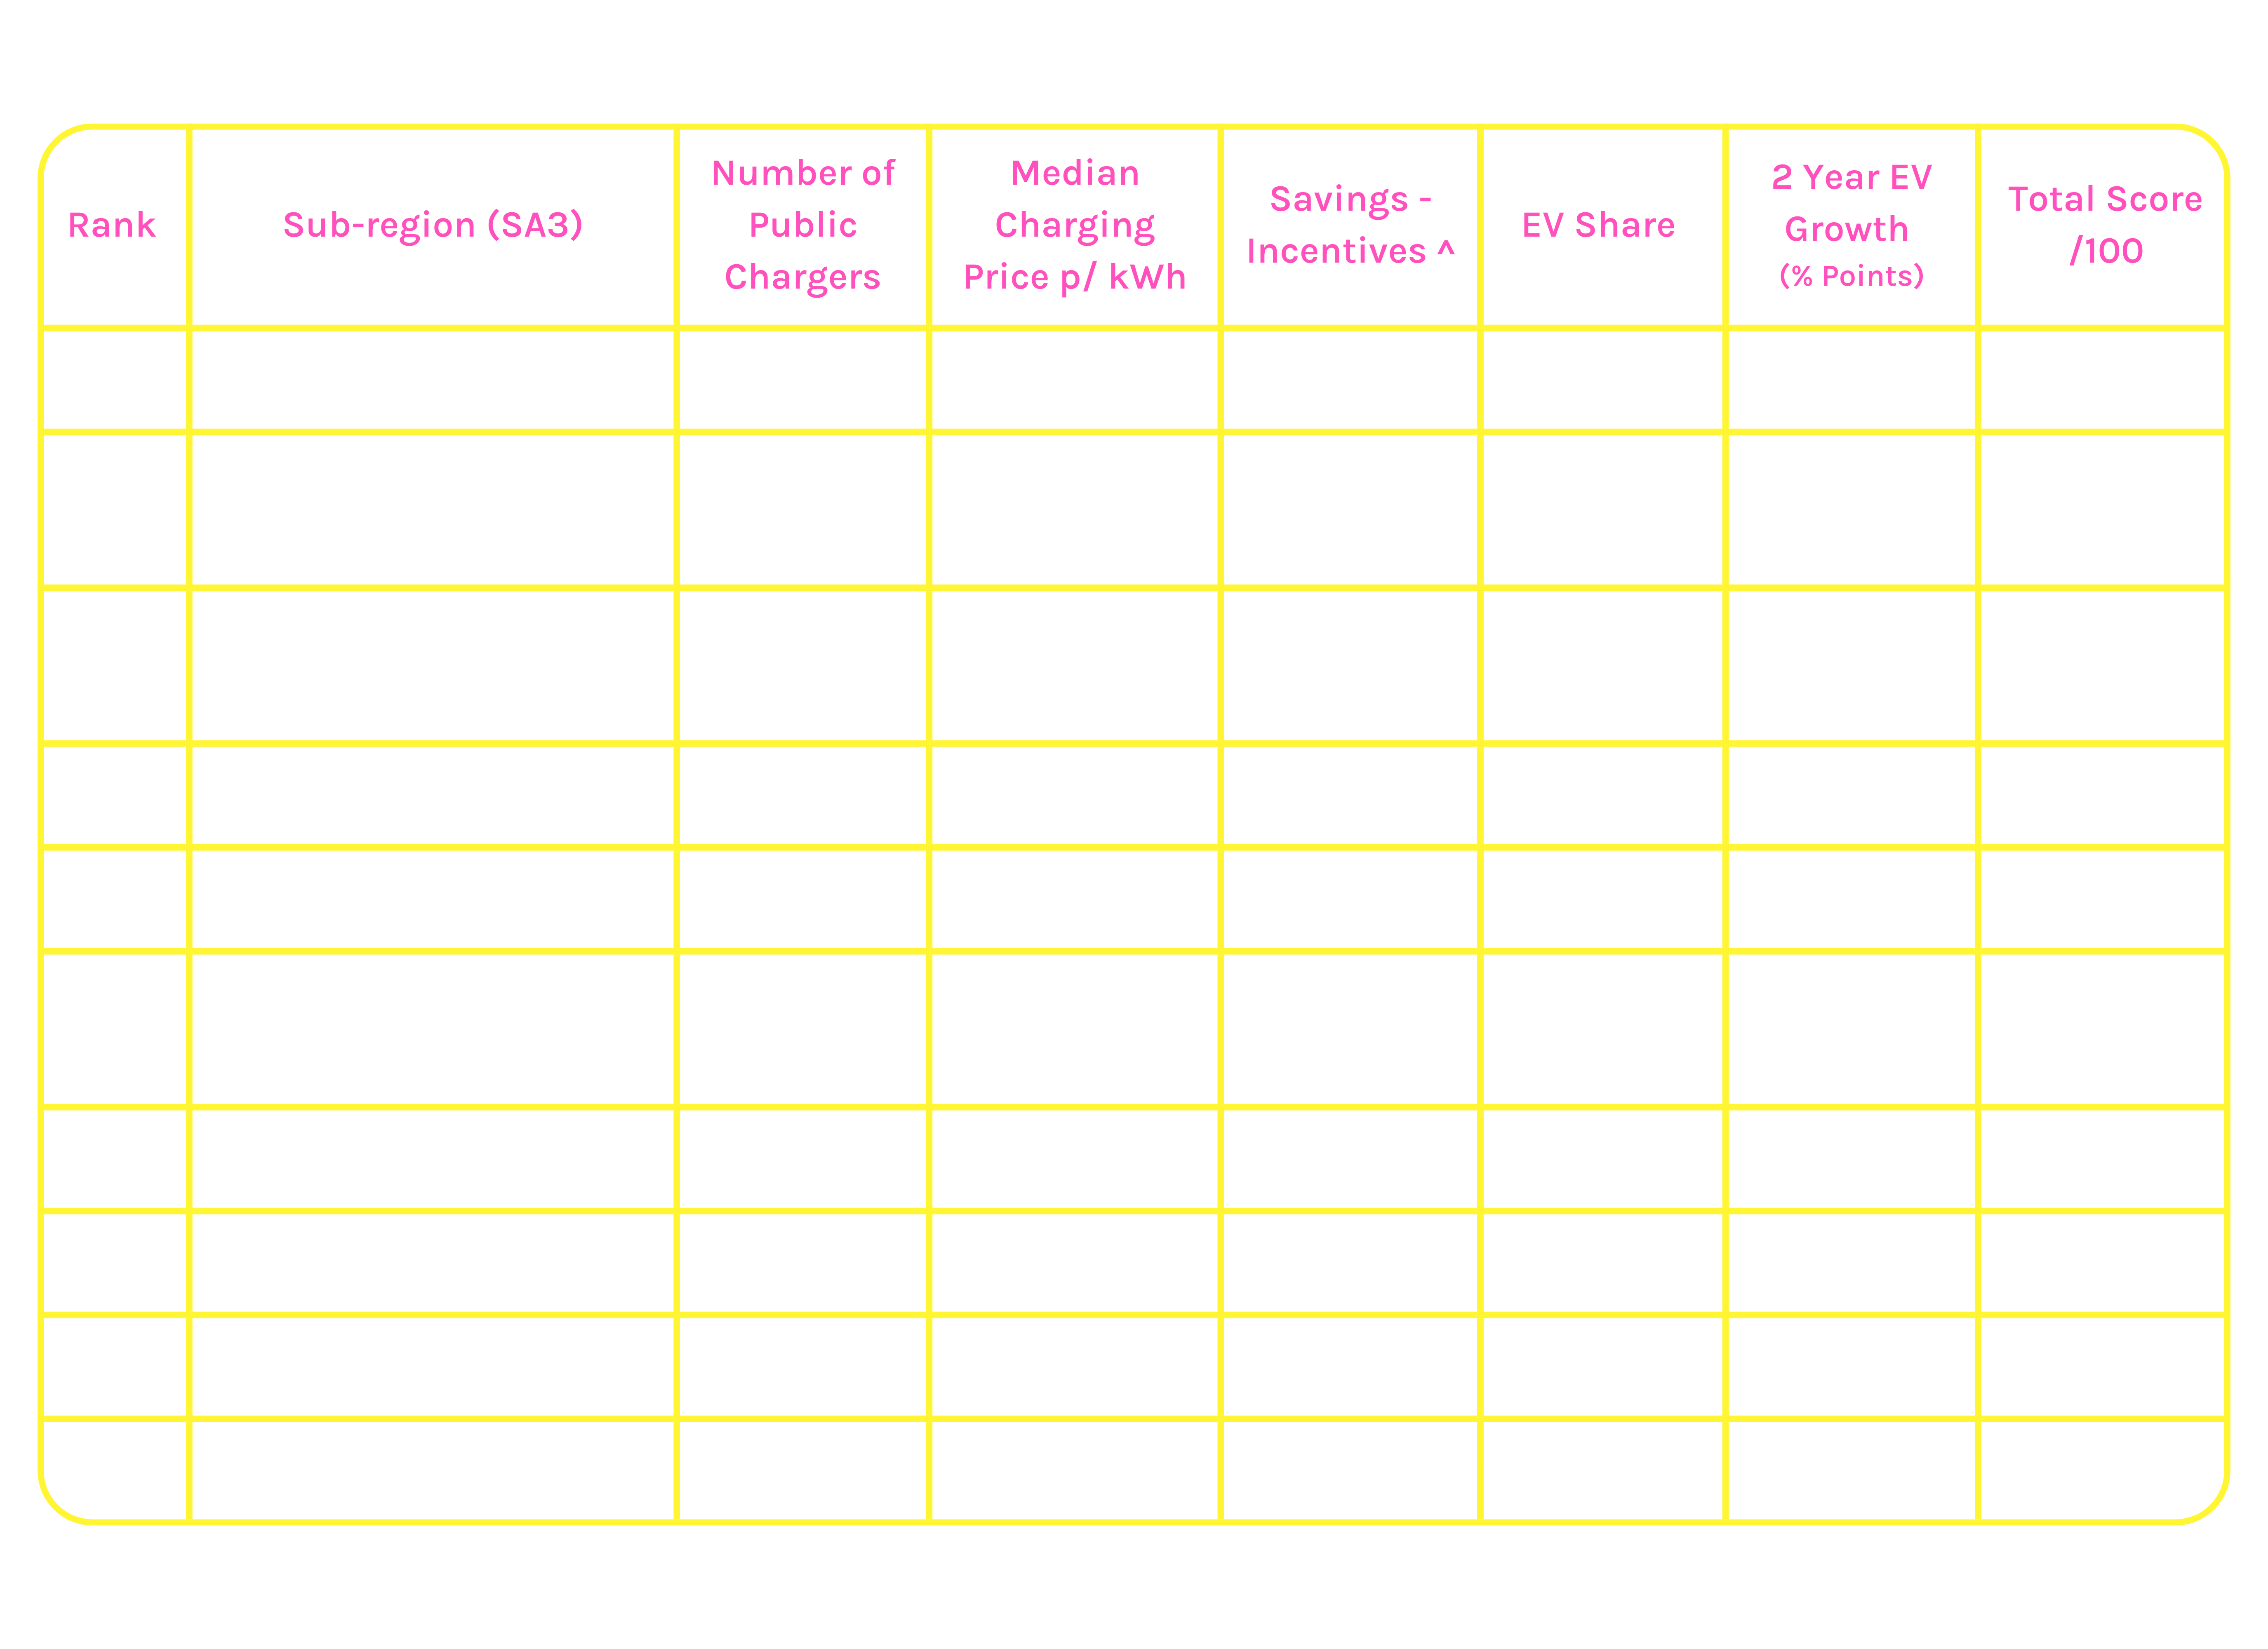
When breaking down the data to SA3^^ level, East Canberra takes the top spot for the best sub-region to own an EV. The region has seen the highest growth in EVs over the last two years and is home to the third-highest percentage of EVs in the area. ACT also offers a great incentive saving of $1,707.50 to encourage residents to purchase low-emission vehicles.
Western Australia’s sub-region of Augusta, Margaret River and Busselton comes in second place, due to the high incentives offered by the WA government, low cost of charging and reasonably high number of chargers.
The sub-region of Strathfield, Burwood and Ashfield ranks in third place. The area scores well for the cost of charging, at $0.49 per kWh (the lowest in Sydney), as well as EV share and EV growth rate. Monash in Victoria follows closely behind.
Brendan Griffiths, Executive Manager at ROLLiN’ comments on the research:
"It’s awesome to see Aussie cities getting on board with electric vehicles. We’ve now got over 2,000 EV charging stations nationwide, and places like New South Wales are adding hundreds more soon. But there’s still a lot of work to do in some areas. Our research highlights how tough it can be to own an EV in regional spots, where public charging stations are scarce. That’s why you see such a tiny EV presence in the outback. If you’re considering getting an EV, I’d recommend checking out how well your local area is set up for electric vehicles.”
The information in this article is accurate at the date of publication. However, readers should not solely rely on the data presented when making decisions about purchasing an electric vehicle (EV). We encourage readers to conduct additional research and consider other factors that may influence their decision, including updated information and individual preferences.
About the data
Our analysis uses 5 metrics that are categorised as either primary and secondary factors to create an index score for each city to determine which caters to the ease in uptake for EVs. Each metric provided was graded on a 100 point scale proportional to its importance in determining its EV friendliness, with cities then given a weighted index score that is used to rank from highest to lowest.
- Infrastructure - Number of chargers assesses the public charging infrastructure available to drivers
- Cost - Median price per kWh evaluates the cost for charging EVs at publicly available outlets
- Popularity - EV Share of all registered light vehicles gauges the current hotspots as a proportion of all other fuel types
- Incentives - Estimated savings from discounts and rebates from state government initiatives that highlight the accessibility and support available to purchase EVs
- Growth - 2 year trend in EV penetration is measured by percentage point growth, which is indicative of recent uptake and potential for further development
For the purpose of this study, the number of EVs is defined as the total of all light vehicles registrations in Australia that are classified solely as Battery Electric Vehicles (BEVs) - a vehicle that exclusively uses a rechargeable battery, which is charged from an external source, to power at least one electric motor with no secondary source of propulsion as at 31 January 2023. The change or growth comparisons have been made from data as at 31 January 2021. Although Plug-in Hybrid Electric Vehicles (PHEVs) also use an electric motor powered by a rechargeable battery and require charging from an external source, they have been excluded from this count due to lack of available data in Australia that provides distinction between PHEVs and other hybrid types.
Cities have been identified at three different geographic levels as outlined by the Australia Bureau of Statistics (ABS) - Greater Capital City Statistical Area (GCCSA), comprising of 15 geographic areas, Statistical Area Level 4 (SA4), comprising 88 geographical areas and Statistical Area Level 3 (SA3) comprising 325 geographical areas. Some regions and sub-regions have not been included in the study such as non-spatial or other territories, as well as 13 sub-regions that lacked requisite data for inclusion such as Norfolk Island, Christmas Island and Blue Mountains South.
Data is sourced from the most recently available datasets for each factor at the time this article is prepared. Note that there has been an increasingly rapid uptake of EVs since the availability of vehicle registration data has been acquired. Infrastructure, Cost, Popularity and Growth data is processed from the postcode geographic level and amalgamated to create city-level data. The full list of data sources and weighting are listed below.
EV charging infrastructure and pricing data included in the report is sourced from Carloop. Reasonable efforts have been made to ensure accuracy, however, we have not independently verified every location.
Data Sources & Weighting
^Please note that state data has been used for government rebate and discounts and applied across all SA4 and SA3 regions accordingly. Estimated savings from registration, stamp-duty and vehicle purchase discounts and rebates on a new EV with $50,000 dutiable value as at September, 2024 - this does not factor in availability of interest-free loan schemes and grants for home charging installation offered by states. Detailed information in table below.
^^Where SA3 level scores are used, localities where there are no chargers are given the lowest possible score based on rankings for infrastructure and cost.
You can read more about the data here.
This is general advice only and does not take into account your individual objectives, financial situation or needs (“your personal circumstances”). Before using this advice to decide whether to purchase a product, you should consider your personal circumstances and the relevant Product Disclosure Statement. Product Disclosure Statement and Target Market Determination are available from rollininsurance.com.au. Insurance issued by Insurance Australia Limited ABN 11 000 016 722 AFSL 227681 trading as Rollin’ Insurance.
To find out more about ROLLiN’s comprehensive car insurance, check out our PDS.